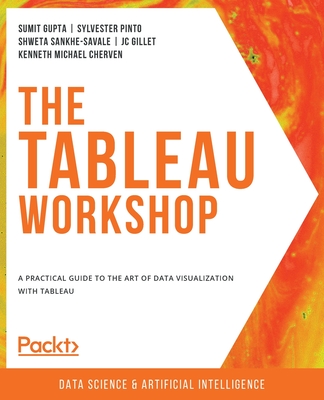
The Tableau Workshop: A practical guide to the art of data visualization with Tableau
暫譯: Tableau 工作坊:使用 Tableau 進行數據視覺化藝術的實用指南
Gupta, Sumit, Pinto, Sylvester, Sankhe-Savale, Shweta
- 出版商: Packt Publishing
- 出版日期: 2022-04-28
- 售價: $2,080
- 貴賓價: 9.5 折 $1,976
- 語言: 英文
- 頁數: 822
- 裝訂: Quality Paper - also called trade paper
- ISBN: 1800207654
- ISBN-13: 9781800207653
-
相關分類:
Data-visualization
海外代購書籍(需單獨結帳)
商品描述
Key Features
- Master the fundamentals of Tableau Desktop and Tableau Prep
- Learn how to explore, analyze, and present data to provide business insights
- Build your experience and confidence with hands-on exercises and activities
Book Description
Learning Tableau has never been easier, thanks to this practical introduction to storytelling with data. The Tableau Workshop breaks down the analytical process into five steps: data preparation, data exploration, data analysis, interactivity, and distribution of dashboards. Each stage is addressed with a clear walkthrough of the key tools and techniques you'll need, as well as engaging real-world examples, meaningful data, and practical exercises to give you valuable hands-on experience.
As you work through the book, you'll learn Tableau step by step, studying how to clean, shape, and combine data, as well as how to choose the most suitable charts for any given scenario. You'll load data from various sources and formats, perform data engineering to create new data that delivers deeper insights, and create interactive dashboards that engage end-users.
All concepts are introduced with clear, simple explanations and demonstrated through realistic example scenarios. You'll simulate real-world data science projects with use cases such as traffic violations, urban populations, coffee store sales, and air travel delays.
By the end of this Tableau book, you'll have the skills and knowledge to confidently present analytical results and make data-driven decisions.
What you will learn
- Become an effective user of Tableau Prep and Tableau Desktop
- Load, combine, and process data for analysis and visualization
- Understand different types of charts and when to use them
- Perform calculations to engineer new data and unlock hidden insights
- Add interactivity to your visualizations to make them more engaging
- Create holistic dashboards that are detailed and user-friendly
Who this book is for
This book is for anyone who wants to get started on visual analytics with Tableau. If you're new to Tableau, this Workshop will get you up and running. If you already have some experience in Tableau, this book will help fill in any gaps, consolidate your understanding, and give you extra practice of key tools.
商品描述(中文翻譯)
**主要特點**
- 精通 Tableau Desktop 和 Tableau Prep 的基本概念
- 學習如何探索、分析和呈現數據,以提供商業洞察
- 通過實作練習和活動來增強您的經驗和信心
**書籍描述**
學習 Tableau 從未如此簡單,這本實用的數據故事講述入門書籍將帶您進入這個領域。《Tableau 工作坊》將分析過程分為五個步驟:數據準備、數據探索、數據分析、互動性和儀表板的分發。每個階段都會清楚地介紹您所需的關鍵工具和技術,並提供引人入勝的真實案例、有意義的數據和實用的練習,讓您獲得寶貴的實作經驗。
在閱讀本書的過程中,您將逐步學習 Tableau,研究如何清理、整理和合併數據,以及如何為特定情境選擇最合適的圖表。您將從各種來源和格式加載數據,進行數據工程以創建提供更深洞察的新數據,並創建吸引最終用戶的互動式儀表板。
所有概念都以清晰、簡單的解釋引入,並通過現實的示例場景進行演示。您將模擬真實世界的數據科學項目,使用案例包括交通違規、城市人口、咖啡店銷售和航空旅行延誤。
在這本 Tableau 書籍結束時,您將具備自信地呈現分析結果和做出數據驅動決策的技能和知識。
**您將學到的內容**
- 成為 Tableau Prep 和 Tableau Desktop 的有效使用者
- 加載、合併和處理數據以進行分析和可視化
- 理解不同類型的圖表及其使用時機
- 執行計算以工程化新數據並解鎖隱藏的洞察
- 為您的可視化添加互動性,使其更具吸引力
- 創建全面且用戶友好的儀表板
**本書適合誰**
本書適合任何想要開始使用 Tableau 進行視覺分析的人。如果您是 Tableau 的新手,這本工作坊將幫助您快速上手。如果您已經有一些 Tableau 的經驗,本書將幫助填補任何知識空白,鞏固您的理解,並提供關鍵工具的額外練習。
作者簡介
Sumit Gupta is an analytics professional with more than 7 years' experience spanning across marketing, sales, and product analytics. As a consultant and trainer, he has utilized Tableau to build better data-driven teams for his organization. Sumit specializes in translating vast amounts of data into easy-to-understand dashboards which provide actionable intelligence. He is a Tableau Certified Associate and enjoys training data enthusiasts to become better Tableau developers and certified Tableau associates. This book is one such effort to reach masses.
Sylvester Pinto has been using Tableau for almost a decade now for improving business performance for different industries. Sylvester has designed various business solutions using Tableau for different organizations leading to a huge impact to improve their businesses. He has a Tableau certification and as a consultant designs solutions for various organizations.
Shweta Sankhe-Savale is the Co-founder and Head of Client Engagements at Syvylyze Analytics (pronounced as civilize), a boutique business analytics firm specializing in visual analytics. Shweta is a Tableau Desktop Qualified Associate and a Tableau Accredited Trainer. Being one of the leading experts on Tableau in India, Shweta has translated her experience and expertise into successfully rendering analytics and data visualization services for numerous clients across a wide range of industry verticals. She has taken up numerous training as well as consulting assignments for customers across various sectors like BFSI, FMCG, Retail, E-commerce, Consulting & Professional Services, Manufacturing, Healthcare & Pharma, ITeS etc. She even had the privilege of working with some of the renowned Government and UN agencies as well. Combining her ability to breakdown complex concepts, with her expertise on Tableau's visual analytics platforms, Shweta has successfully trained over a 1300+ participants from 85+ companies.
作者簡介(中文翻譯)
Sumit Gupta 是一位擁有超過 7 年經驗的分析專業人士,專注於行銷、銷售和產品分析。作為顧問和培訓師,他利用 Tableau 為他的組織建立更好的數據驅動團隊。Sumit 專長於將大量數據轉換為易於理解的儀表板,提供可行的智慧。他是 Tableau 認證助理,並喜歡培訓數據愛好者成為更好的 Tableau 開發者和認證 Tableau 助理。本書就是這樣一個努力,旨在讓更多人受益。
Sylvester Pinto 使用 Tableau 已近十年,致力於改善不同產業的商業表現。Sylvester 為不同組織設計了各種商業解決方案,對其業務產生了巨大的影響。他擁有 Tableau 認證,並作為顧問為各種組織設計解決方案。
Shweta Sankhe-Savale 是 Syvylyze Analytics(發音為 civilize)的聯合創始人及客戶參與負責人,這是一家專注於視覺分析的精品商業分析公司。Shweta 是 Tableau Desktop 認證助理和 Tableau 認可培訓師。作為印度 Tableau 領域的領先專家之一,Shweta 將她的經驗和專業知識轉化為成功為眾多客戶提供分析和數據可視化服務,涵蓋廣泛的行業領域。她曾為 BFSI、FMCG、零售、電子商務、顧問及專業服務、製造、醫療保健及製藥、ITeS 等各個行業的客戶承擔多項培訓和顧問任務。她甚至有幸與一些知名的政府和聯合國機構合作。結合她將複雜概念簡化的能力以及對 Tableau 視覺分析平台的專業知識,Shweta 成功培訓了來自 85 家以上公司的 1300 多名參與者。
目錄大綱
- Introduction: Visual Analytics with Tableau
- Data Preparation: Using Tableau Desktop
- Data Preparation: Using Tableau Prep
- Data Exploration: Comparison and Composition
- Data Exploration: Distributions and Relationships
- Data Exploration: Exploring Geographical Data
- Data Analysis: Creating and Using Calculations
- Data Analysis: Creating and Using Table Calculations
- Data Analysis: Creating and Using Level of Details (LOD) Calculations
- Dashboards and Storyboards
- Tableau Interactivity: Part 1
目錄大綱(中文翻譯)
- Introduction: Visual Analytics with Tableau
- Data Preparation: Using Tableau Desktop
- Data Preparation: Using Tableau Prep
- Data Exploration: Comparison and Composition
- Data Exploration: Distributions and Relationships
- Data Exploration: Exploring Geographical Data
- Data Analysis: Creating and Using Calculations
- Data Analysis: Creating and Using Table Calculations
- Data Analysis: Creating and Using Level of Details (LOD) Calculations
- Dashboards and Storyboards
- Tableau Interactivity: Part 1


