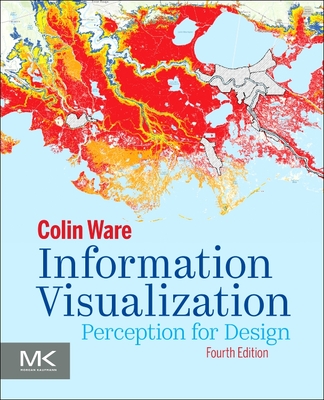
Information Visualization: Perception for Design, 2/e
暫譯: 資訊視覺化:設計的感知,第二版
Colin Ware
- 出版商: Morgan Kaufmann
- 出版日期: 2004-04-21
- 售價: $1,188
- 語言: 英文
- 頁數: 486
- 裝訂: Hardcover
- ISBN: 1558608192
- ISBN-13: 9781558608191
已過版
買這商品的人也買了...
-
 $980Advanced Compiler Design and Implementation
 -
 $1,029Operating System Concepts, 6/e (Windows XP Update)
 -
 演算法導論 (Introduction to Algorithms, 2/e)
$860$679 -
 ASP.NET 程式設計徹底研究
$590$466 -
 Building Embedded Linux Systems
$1,730$1,644 -
 Java 2 物件導向程式設計範例教本
$580$493 -
 鳥哥的 Linux 私房菜─基礎學習篇增訂版
$560$476 -
 The Rational Unified Process: An Introduction, 3/e (Paperback)
$1,880$1,786 -
 SCJP‧SCJD 專業認證指南 (Sun Certified Programmer & Developer for Java 2 #310-305 與310-027)
$850$723 -
 人月神話:軟體專案管理之道 (20 週年紀念版)(The Mythical Man-Month: Essays on Software Engineering, Anniversary Edition, 2/e)
$480$379 -
 JSP 2.0 技術手冊
$750$593 -
 CCNA 認證教戰手冊 Exam 640-801 (CCNA Cisco Certified Network Associate Study Guide, 4/e)
$780$663 -
 FreeBSD 5.x 架設管理與應用
$490$382 -
 Flash MX 2004 動畫搖頭玩 ActionScript 經典範例
$580$493 -
 最新 JavaScript 完整語法參考辭典 第三版
$490$382 -
 Word 排版藝術
$620$490 -
 $1,176Computer Organization and Design: The Hardware/Software Interface, 3/e(IE) (美國版ISBN:1558606041)
 -
 CSS 網頁設計師手札 (The CSS Anthology 101 Essential Tips, Tricks & Hacks)
$450$383 -
 Linux iptables 技術實務─防火牆、頻寬管理、連線管制
$620$527 -
 深入淺出 Java 程式設計, 2/e (Head First Java, 2/e)
$880$695 -
 SQL 語法範例辭典
$550$468 -
 操作介面設計模式 (Designing Interfaces)
$880$695 -
 $1,274Computer Architecture: A Quantitative Approach, 4/e (Paperback)
 -
 深入淺出物件導向分析與設計 (Head First Object-Oriented Analysis and Design)
$880$695 -
 挑戰 PHP 5 MySQL 程式設計樂活學
$580$458
商品描述
Description:
Most designers know that yellow text presented against a blue background
reads clearly and easily, but how many can explain why, and what really are the
best ways to help others and ourselves clearly see key patterns in a bunch of
data?
This book explores the art and science of why we see objects the
way we do. Based on the science of perception and vision, the author presents
the key principles at work for a wide range of applications--resulting in
visualization of improved clarity, utility, and persuasiveness. The book offers
practical guidelines that can be applied by anyone: interaction designers,
graphic designers of all kinds (including web designers), data miners, and
financial analysts
Contents:
Figure Credits
Foreword
Preface
Preface to the First
Edition
Chapter 1: Foundation for a Science of Data Visualization
Chapter
2: The Environment, Optics, Resolution, and the Display
Chapter 3: Lightness,
Brightness, Contrast, and Constancy
Chapter 4: Color
Chapter 5: Visual
attention and information that Pops Out
Chapter 6: Static and Moving
Patterns
Chapter 7: Visual Objects and Data Objects
Chapter 8: Space
Perception and the Display of Data in Space
Chapter 9: Images, Words, and
Gestures
Chapter 10: Interacting with Visualizations
Chapter 11: Thinking
with Visualization
Appendix A: Changing Primaries
Appendix B: CIE Color
Measurement System
Appendix C: The Perceptual Evaluation of Visualization
Techniques and Systems
Bibliography
Subject Index
Author Index
About
the Author
商品描述(中文翻譯)
# 描述:
大多數設計師都知道,黃色文字在藍色背景上顯示時,閱讀起來清晰且容易,但有多少人能解釋為什麼,以及如何幫助他人和自己清楚地看到一堆數據中的關鍵模式?
本書探討了我們為何以特定方式看待物體的藝術與科學。基於感知和視覺的科學,作者提出了在各種應用中運作的關鍵原則,從而實現了更高的清晰度、實用性和說服力的可視化。本書提供了任何人都可以應用的實用指導:互動設計師、各類平面設計師(包括網頁設計師)、數據挖掘者和金融分析師。
# 內容:
圖表來源
前言
序言
第一版序言
第1章:數據可視化科學的基礎
第2章:環境、光學、解析度與顯示
第3章:亮度、明亮度、對比度與恆定性
第4章:顏色
第5章:視覺注意力與突出的信息
第6章:靜態與動態模式
第7章:視覺物體與數據物體
第8章:空間感知與數據在空間中的顯示
第9章:圖像、文字與手勢
第10章:與可視化的互動
第11章:以可視化進行思考
附錄A:改變的主色
附錄B:CIE顏色測量系統
附錄C:可視化技術與系統的感知評估
參考文獻
主題索引
作者索引
關於作者


